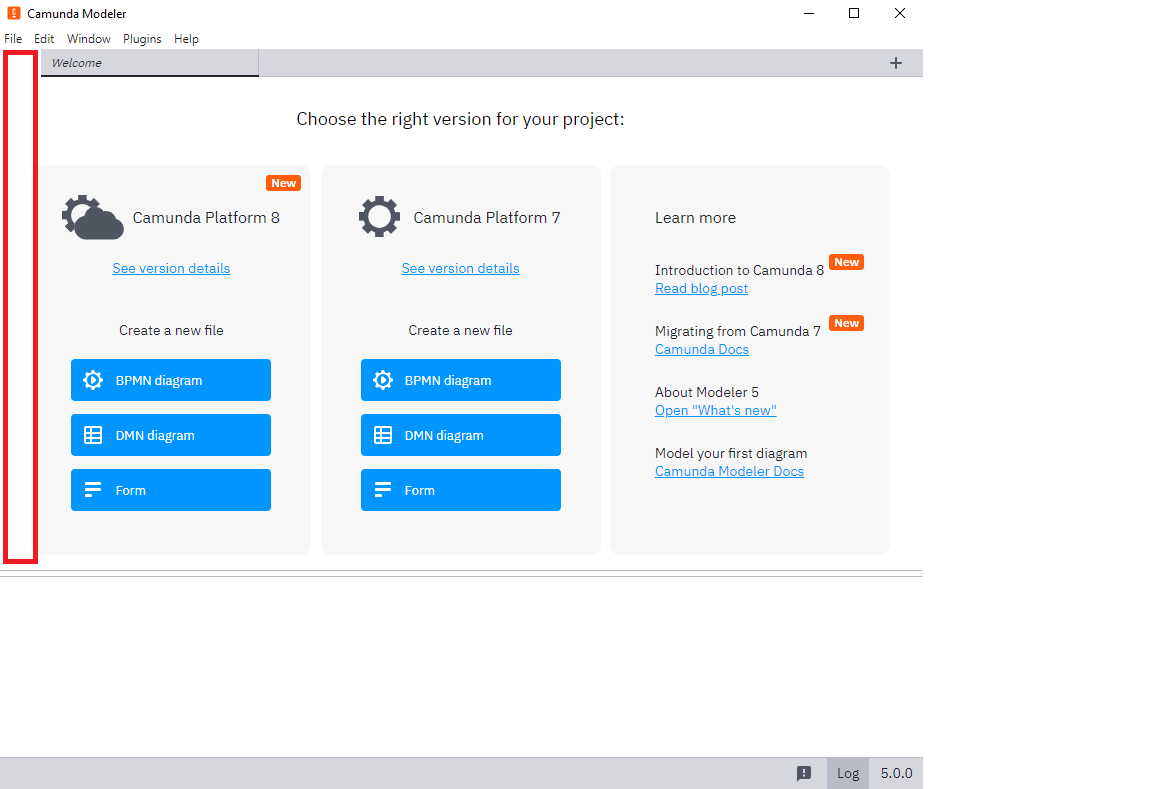
I would like my client extension to add a panel on the left of the modeler. Basically similar to the properties panel on the right. I tried to follow the “slot” approach, but sadly I was only able to find some for tabs, status bar or bottom panel. Is there any other integration point I could use?
Also is there a way to push custom error messages or warnings to the problems tab ?
Unfortunately, there is no API to add a panel on the left hand side. Can you tell more about your use case? Is this panel intended to be for the entire app or only a single diagram?
It’s for the entire app, we are looking to develop a panel to display project structure similar to the project explorer tab in eclipse or IntelliJ.
Also regarding the linting feature, can we use that for displaying even custom errors that aren’t related to node, for example if the plugin I developed throws any error, I want to catch that and display jt ? I was wondering if we can directly inject reporter or other service into existing plugin to push warnings or errors to problem window, is that possible ?
In that case, I can only see this happen via some sort of hacking the DOM. Notice that if you imperatively add a panel in the editor view, React may remove it anyway. So the solution will be quite vulnerable.
Yes I already tried react dom it works well on dev but on prod version of the app the component is not getting rendered as expected, okay so yeah bottom panel was an option on my mind but I wanted to check if there are ways to display on the left side near to the palette.
Let me check with the displayNotification and get back !!
I tried using display notification service it works as expected but I am more inclined towards problems tab, is there a way to report error or warning which aren’t essentially lint error but custom errors ?
I can see we call reporter.report method to push the error, by any means can we inject and use this directly in our plugins @barmac ?
Okay I see, then will go with the bottom panel approach as you mentioned, by any means are we controlling the max height of the bottom panel, as I am not able to expand the panel beyond a point