Please look at the picture
Please explain what you’re trying to do and what you are struggling with. Thanks.
1 Like
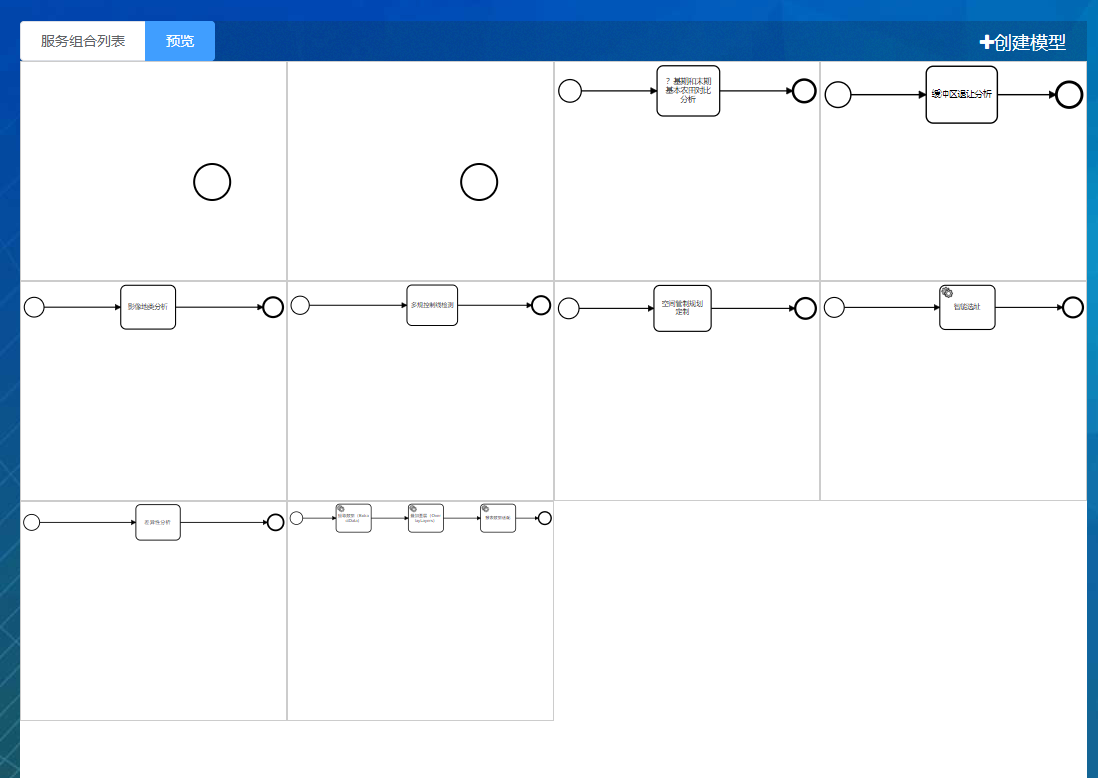
Hello, I’d like to use a web page to make a preview of the flow charts. I have a lot of flow charts. I want them all to be displayed, just like the above, but these flow charts are not shown in the middle.
How are you embedding the diagrams? Can you share some code?
This is my code, a Vue project.
<template>
  <div class="diagram-list" v-loading="loading" ref="diagramList">
    <!-- <div class="diagram" v-for="(item,index) in modelList" :key="index" :ref="'diagram' + index"></div> -->
  </div>
</template>
<script>
import {mapGetters} from 'vuex';
import Viewer from 'bpmn-js/dist/bpmn-viewer.production.min.js'
export default {
  data () {
    return {
      loading: false,
      page: {
        current: 1,
        firstResult: 0,
        maxResults: 10
      }
    }
  },
  computed: {
    ...mapGetters([
      'currentEngine',
      'modelList'
    ])
  },
  mounted () {
    let self = this;
    let listDom = self.$refs.diagramList;
    let list = self.modelList;
    listDom.innerHTML = '';
    for (let i = 0;i < list.length;i++) {
      (function (i) {
        let div = document.createElement('div');
        div.className = 'diagram';
        listDom.appendChild(div);
        let viewer = new Viewer({
          container: div
        });
        viewer.importXML(list[i].bpmn, function (err) {
          if (err) {
            console.error(err);
          } else {
            viewer.get('canvas').zoom('fit-viewport');
          }
        });
      }(i));
    }
  }
}
</script>
<style scoped>
.diagram-list{
  height: 100%;
  background-color: #FFF;
}
.diagram-list /deep/ > .diagram{
  width: 25%;
  height: 220px !important;
  border: 1px solid #ccc;
  float: left;
}
</style>
My method is to first generate the div elements from Vue, and then put the graph in Div.
I wonder if this is the right way. This is the way I can think of it.
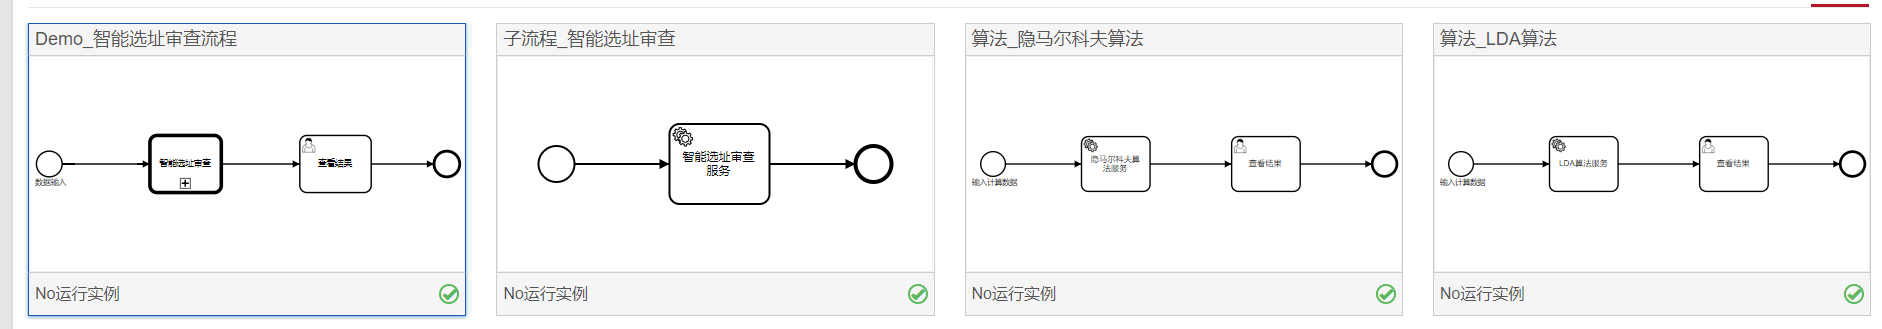
This is the effect I want, but it should be done with Vue.
I hope the chart can be in the middle.
this.viewer.get('canvas').zoom('fit-viewport')
这样可以居中