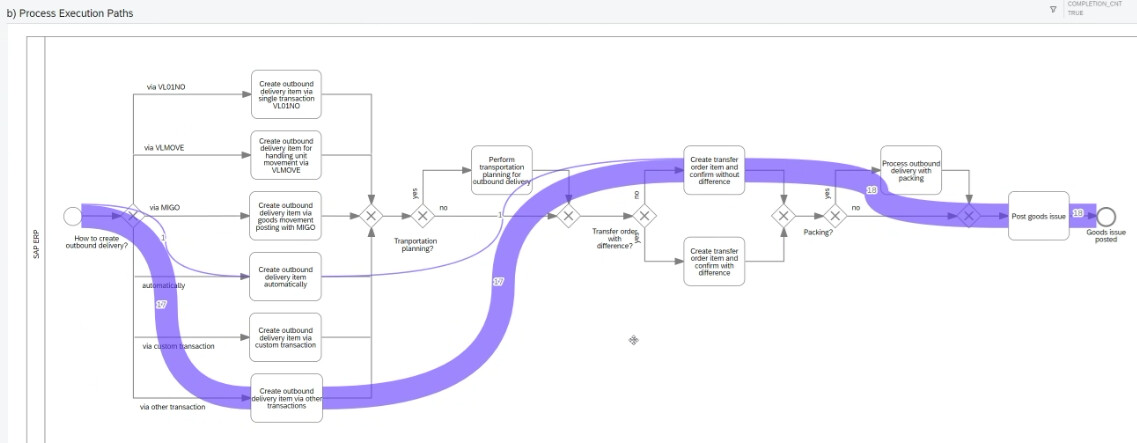
I would like to enhance the standard BPMN diagrams with additional graphical elements and recently I was was inspired with Signavio Process Execution path visualization (Attached as a screenshot). I would like to generate it based on a additional JSON/XML (Would like to avoid changing standard BPMN diagram atrivutes/structure). If I understood correctly I would need to create/modify custom render and model extension (), and that’s it, or did I missed something?
The thickness of the line should represent a ration of cases going through specific activities.
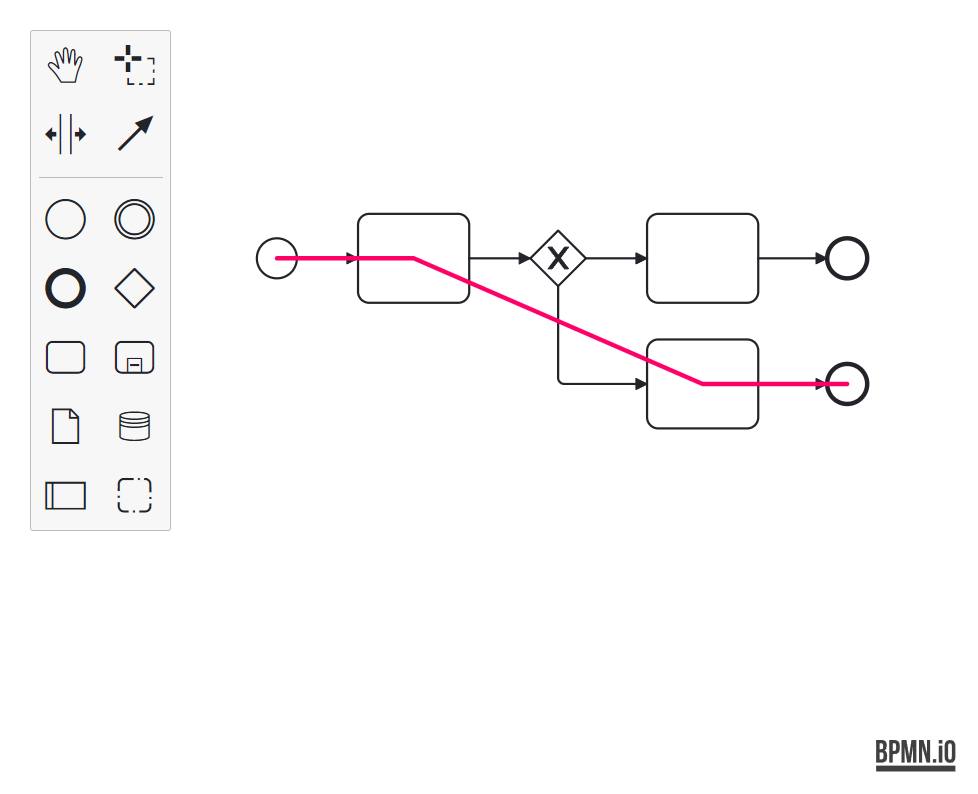
To render visuals like this you don’t need a custom renderer (since you don’t want to change how the shapes and connections are rendered) or a custom model (since you don’t want to add any custom data). In fact, it’s pretty simple.
You can create a custom SVG layer through canvas.getLayer("myLayer"); and add your custom visuals.