Has any one tried drawing bezier curve using diagramjs? is there api/way to do it already?
Thanks and Regards
Rajender
Has any one tried drawing bezier curve using diagramjs? is there api/way to do it already?
Thanks and Regards
Rajender
ok THanks… I got this working.
Could you provide an example for others interested how you got things working?
yes, sure…will post it this week
function toSVGPoints(points) {
  var result = '';

  for (var i = 0, p; (p = points[i]); i++) {
    result += p.x + ',' + p.y + ' ';
  }

  return result;
}

function toSVGCurve(points) {
    var result = '';
    var result = 'm  ' + points[0].x + ',' + points[0].y;
    if (!isCurve) {
        for (var i = 1; i < points.length; i++) {
            result += 'L' + points[i].x + ',' + points[i].y + ' ';
        }
    } else {
        if (points.length >= 3) {
            result += ' Q' + points[1].x + ',' + points[1].y;
            result += ' ' + points[2].x + ',' + points[2].y;
        }
        for (var i = 3, p; (p = points[i]) ; i++) {
            result += ' T' + points[i].x + ',' + points[i].y;
        }
    }

    return result;
}


module.exports.createCurve = function (points, attrs) {
    return Snap.create('path', { d: toSVGCurve(points) }).attr(attrs || {});
};

module.exports.updateCurve = function (gfx, points) {
    return gfx.attr({ d: toSVGCurve(points) });
};
In the RenderUtil.js of diagram.js

And in the modeler renderer

  function isCurvedConnection(connection) {
      if (connection.type === 'vdml:SequenceFlow') {
          return true;
      }
      return false;
  }
  function createPathFromConnection(connection) {
    var isCurve = isCurvedConnection(connection);
    var waypoints = connection.waypoints;

    var pathData = 'm  ' + waypoints[0].x + ',' + waypoints[0].y;
    if (!isCurve) {
        for (var i = 1; i < waypoints.length; i++) {
            pathData += 'L' + waypoints[i].x + ',' + waypoints[i].y + ' ';
        }
    } else {
        if (waypoints.length >= 3) {
            pathData += ' Q' + waypoints[1].x + ',' + waypoints[1].y;
            pathData += ' ' + waypoints[2].x + ',' + waypoints[2].y;
        }
        for (var i = 3, p; (p = waypoints[i]) ; i++) {
            pathData += ' T' + waypoints[i].x + ',' + waypoints[i].y;
        }
    }
    return pathData;
  }
Used the above code to draw curve…
Thanks for sharing your solution with us.
Hello @Rajender,
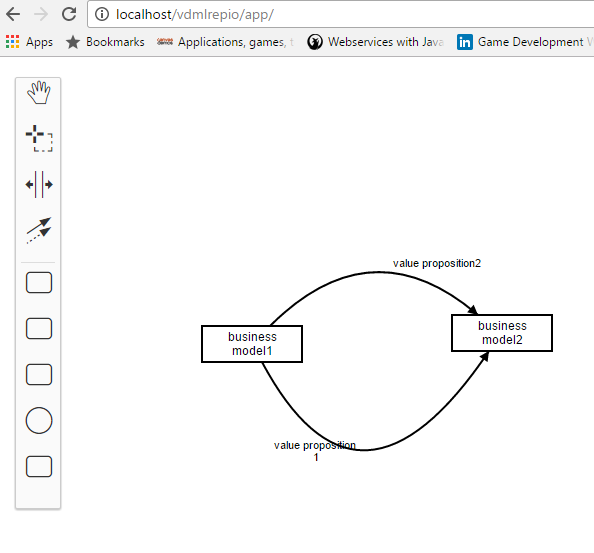
how does a process with bezier curve look like? I’m curious. Could you please post a picture?
Cheers, Ingo
Please find attached a screen shot of a new modeller I am working on…this shows the value propositions being exchanged between 2 business models
My variant of smooth connection rendering is based on this StackOverflow answer (http://stackoverflow.com/questions/7054272/how-to-draw-smooth-curve-through-n-points-using-javascript-html5-canvas).
    var waypoints = connection.waypoints;

    var pathData = 'm  ' + waypoints[0].x + ',' + waypoints[0].y;
    if (waypoints.length === 2) {
      pathData += ' L' + waypoints[1].x + ',' + waypoints[1].y;
      return pathData;
    } else {
      // http://stackoverflow.com/questions/7054272/how-to-draw-smooth-curve-through-n-points-using-javascript-html5-canvas
      pathData += 'Q';
      var i;
      for (i = 1; i < waypoints.length - 2; i++) {
        var xc = (waypoints[i].x + waypoints[i + 1].x) / 2;
        var yc = (waypoints[i].y + waypoints[i + 1].y) / 2;
        pathData += ' ' + waypoints[i].x + ',' + waypoints[i].y;
        pathData += ' ' + xc + ',' + yc;
      }
      pathData += ' ' + waypoints[i].x + ',' + waypoints[i].y;
      pathData += ' ' + waypoints[i+1].x + ',' + waypoints[i+1].y;
    }
    return pathData;
Thank you…this looks smother.Only issue is we could also have no of waypoints >2 but still have straight lines…so we need another parameter to say if its a curve.
Hey, could you outline how you achieve this a little bit more? Where would I have to enter this to get started?
Thanks!
Please do not necrobump old topics. Instead link to this thread from new topic.
You can use svg-curves for this purpose.