Thanks for the clarification @rene51.
I’ve simulated a quick modeling session (1:10 minutes) based on your diagram. During the session I recorded the JS Heap Allocation using the Chromium Dev Tools. My observations based on the recording (screenshot below) is that there is not much we need to worry about right now.
I’m happy to be proven wrong of course!
Understanding Memory Allocation
To better understand memory allocation of our library two things are important to know:
- We record user operations using the
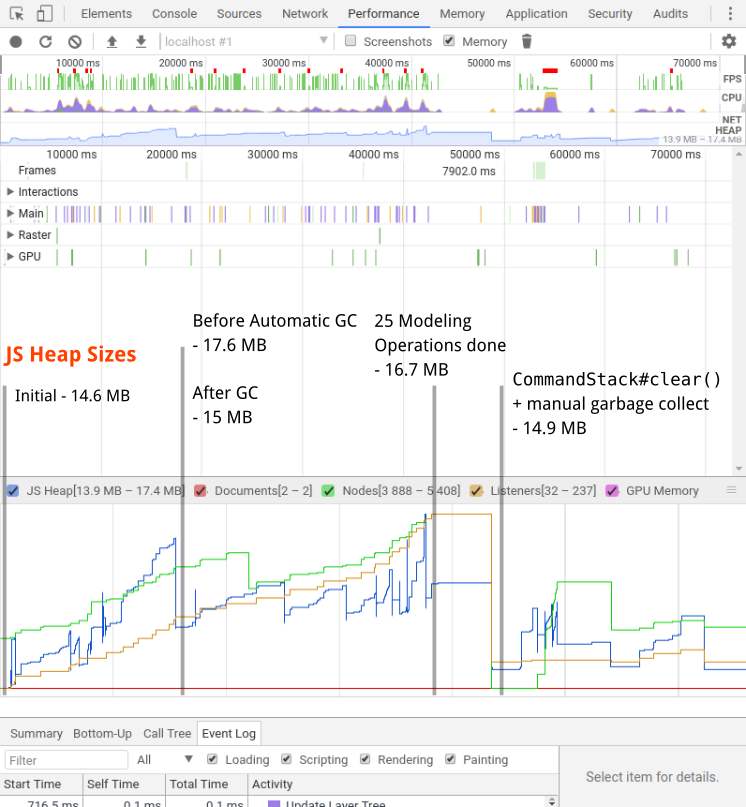
CommandStack. This allows users to undo and redo what they did during a modeling session. To realistically detect leaks you’d need toCommandStack#clear()as part of your test run in order to clear the edit log. - A lot of things are happening under the scenes during modeling. Once in a while the browser performs garbage collection (GC). That, however is approximate and may not find all objects to be cleaned up in a single sweep (cf. MDN memory management for a good read on the basics). To do proper check you must perform manual GC at least once after you completed your test run.
Annotated Modeling Session
This screenshot shows the heap allocation during a simulated modeling session.